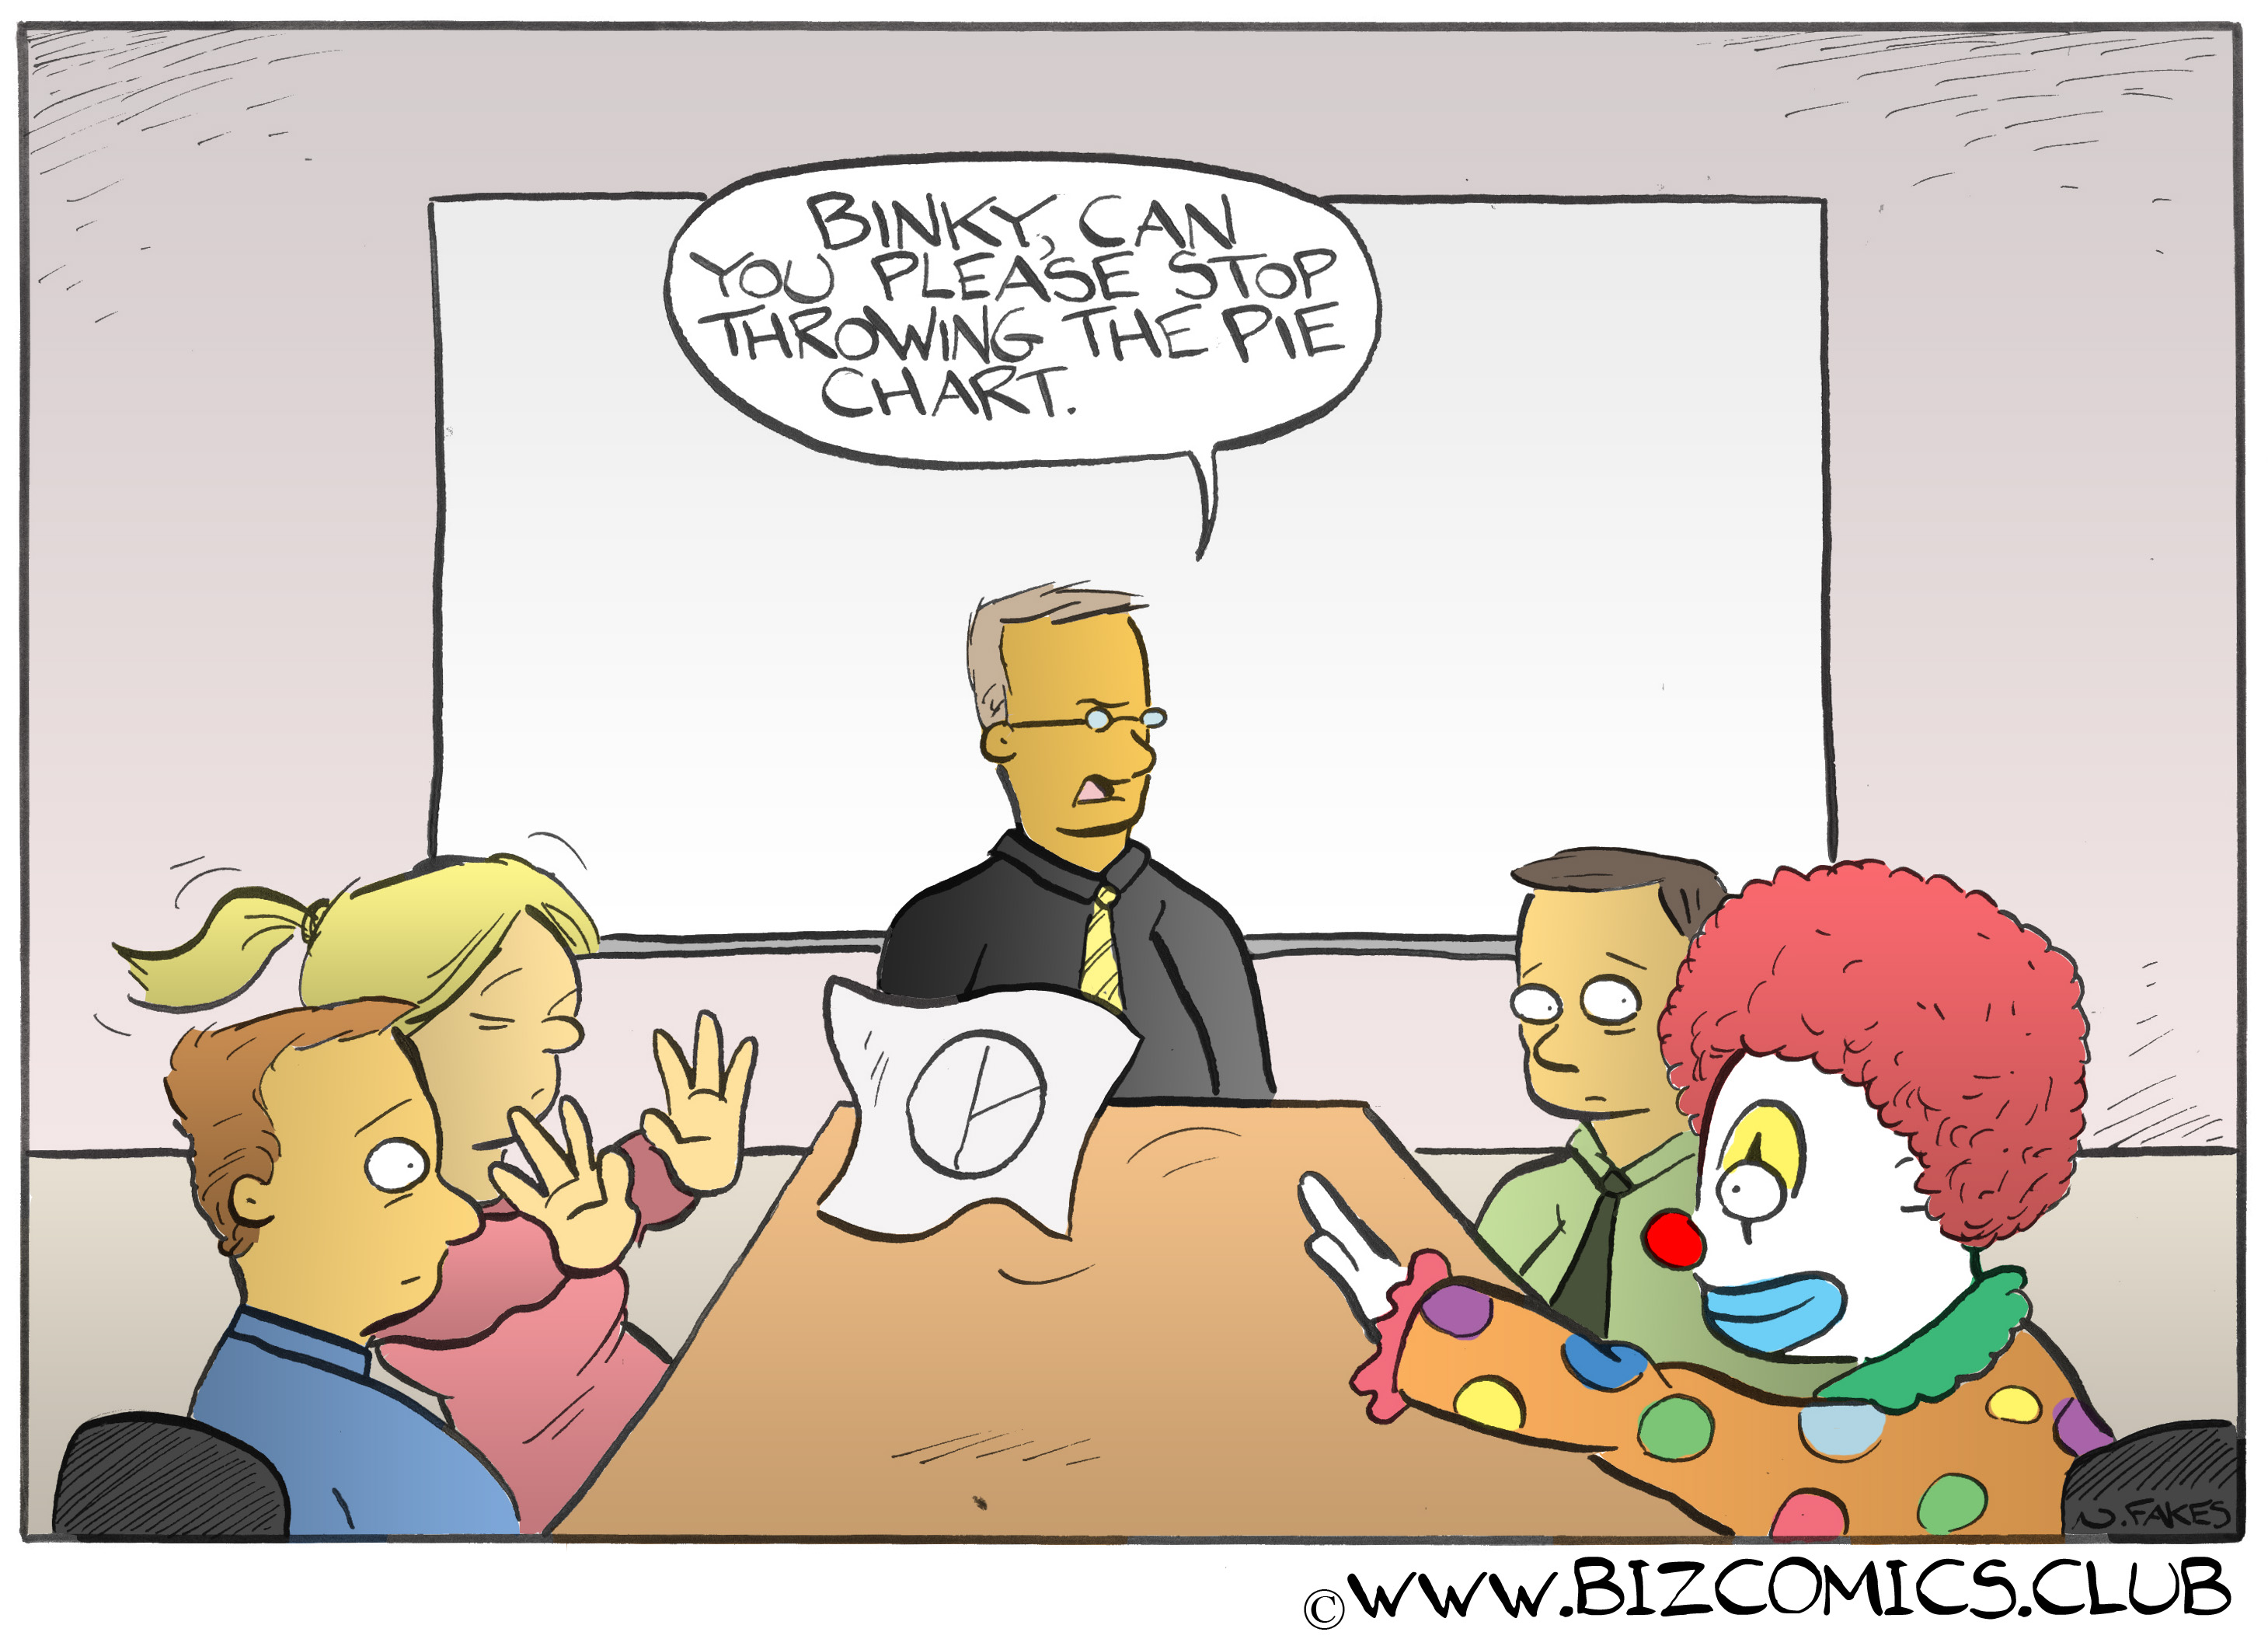
We love slapstick comedy as much as anybody. (Maybe more, in fact.) But like everything else, there’s a time and a place for it. We love to laugh in meetings, too. But it’s better to be laughing with someone than at someone. So, it really makes us wonder why some folks insist on throwing charts in our faces in the hope that said charts will make up for the presenter’s disarming lack of substance.
The list is seemingly endless, of course. There are line charts, bar charts, Gantt charts, distribution charts, composition charts, flow charts, process charts, location charts, trend charts, comparison charts, relationship charts, column charts, area charts, scatter charts, bubble charts, surface charts, Cartesian charts, net charts, stock charts, pie charts, donut charts, blueberry popover charts, and our personal favorites — Boston Cream charts — to say nothing of word clouds and all manner of graphs and diagrams, Venn and otherwise.
But all of that implies a question, which we’re irresistibly compelled to ask: Does the fact that you have a pie necessarily mean you have to throw it?
If not, and by way of alternatives, here are a few modest suggestions, guaranteed to ensure everyone in attendance at your next meeting is raptly attentive and fully engaged:
- Singing and dancing. Politicians have been using this approach effectively forever. To go back a mere 51 years, here’s a musical tribute to the tactic from 1965.
- Fire walking. As a means of killing time and filling in dead spots in your presentation, this tactic has been used effectively by people as historically and culturally diverse as Brahmin priests, ancient Romans, various and sundry masochists, and Tony Robbins.
- Fill-In-The-Blanks PowerPoint. This interactive exercise is a particular favorite of the collaborative and/or the clueless. If everyone in the meeting is running Windows and using Microsoft Office — and they’re all connected via email or an instant messaging app — the participants can contribute charts, graphs, diagrams, and other images using Excel, Visio … or Draw Free! The presenter, then, can create his slides on the spot, letting the rest of the folks in the room determine the content. It’s a real win/win.
As a last resort, if you absolutely have to throw a pie, be it a chart or Vanilla Custard, do it right.


I liked the blog even more than the cartoon. Not that I don’t like the cartoon, because I do like it. But it makes loads more sense with the blog. And the blog makes a good point. Meetings should just be there so everyone can get the same information at the same time and be able to collaborate about that information instantaneously.
Thank you, Tanya. We agree. Like everything else, the purposes for meetings have to be revisited regularly to keep them from wandering off course. And it’s always good to be reminded how valuable a resource time is. We’re glad you joined the conversation.